Monday, July 16, 2012

Midnight in the Garden of GOODS and AEGIS

I just could not resist the pun on John Berendt's best-seller as a title for the following tale of recent CANDELS behind-the-scenes adventures with Hubble Space Telescope ("HST") scheduling.  Much of my CANDELS effort, thus far, has been devoted to leading our Observations Planning and Scheduling Working Group.  In the metaphorical garden-of-science that will be the CANDELS observations, I fancy myself as both landscape architect and master gardener.  I do hope the kind reader will abide, as the explication of the title's strained pun will prove useful to the narrative.

CANDELS burning low...

At the time of writing, the HST observations that comprise CANDELS are roughly two-thirds finished. What still remains? Two target regions of our five total, the two northern-most in the sky:
In short: GOODS and AEGIS (see title, above).  I hasten to emphasize that absolutely no moral judgement whatsoever is to be inferred by this pun — both surveys have produced good science by good people! Indeed, large elements of both survey teams (including yours truly, from GOODS) merged HST proposals to form the CANDELS collaboration.

Anchorage in the the Spring

In mid-June, I had the pleasure of attending the American Astronomical Society ("AAS") semi-annual conference.  This time around, the AAS convened way up north, in Anchorage, Alaska. Along with a good bit of sight-seeing beforehand/afterward, I and some other team members showcased early CANDELS science results (see recent blog post).  The northern portion of Alaska, well north of Anchorage, resides above the Arctic Circle in the so-called "Land of the Midnight Sun". So called, because anywhere north of the Arctic Circle, for a portion of the year, the Sun will never set.  Translated into astronomy jargon that will re-appear later: the Sun will never enter occultation by the Earth. 

For most inhabitants of this rotating orb, the always-daily occurrence that the Sun enters occultation by the Earth (and also rises) is unremarkable, the natural order of things.
However, this is a conspiracy of triple-coincidence! Namely:
  1. The Sun has not yet tidally locked the Earth, which is rotating at 0.000696 RPM.  (slightly faster than once per 24 hours!)
  2. The axis of that rotation is only moderately tilted, by 23.4 degrees of arc, with respect to our orbit around the Sun.  Thus the Sun's coordinates in the sky are always oscillating within 23.4 degrees of the Celestial Equator.  Still enough wandering to drive our seasons, though!
  3. Virtually all people (and virtually all else) are living more than 23.4 degrees of latitude away from the North and South Poles.
The sky behaves very differently at the Poles (both North and South) — nothing sets daily: the Moon sets monthly; the Sun sets yearly.  All of the stars in the sky at the Poles never set: they wheel around the horizon at their same elevations, perpetually in view, and visible continuously throughout the months-long intervals when the Sun is far enough below the horizon for a dark sky.  During winter at the Poles, one may say that the entire sky is a "continuous viewing zone", where stars never set and are never hidden from view by the sunlit sky. 

The AAS conference ended just a week short of the Northern solstice (or "summer solstice", for us northerners), when the Sun reaches its farthest point north of the Celestial Equator, and daytime is at its longest in the Northern Hemisphere.  In Anchorage, 19 hours and 20 minutes of daytime, to be exact. I can report firsthand that the five-ish sunless hours of mid-June Anchorage only darkened the sky to a twilight before the sunrise.  Alas for us astronomers, all those non-setting stars wheeled around while hidden by the ever-too-bright sky during the several-day conference. 

Midnight in the Garden...

In June, midnight in the (Alaska Botanical) Garden is almost
this bright.  [Credit : Barbara Miller]
What is bad for astronomers in Alaska (nighttime never dark) is probably good for plants in Alaska.  I did some nature sightseeing around Anchorage, but unfortunately was unable to visit the city's lovely Alaska Botanical Garden.  I gather from their website that, unlike most of the rest of Anchorage, the various Garden exhibits remain open all through the "night". 

Had bright-night insomnia (and/or jet lag) been a problem for me, I could thus have spent many a midnight in the Garden, perhaps reading a best-selling novel, perhaps contemplating GOODS and AEGIS overhead, continuously viewable but for the twilight sky.

Panning upward from this pastoral scene, consider now the view from the Hubble Space Telescope some 550 kilometers above, racing along a full circuit of its low-Earth orbit every 96 minutes.  This remote-controlled satellite-telescope must keep pointed well away from the Sun (greater than 50 degrees) at all times, to avoid overheating its sensitive ultra-cooled internals. For the same reason, it must also keep pointed out away from the limb of the Earth, by at least 20 degrees if daytime there, or by at least 6 degrees if nighttime. (Not to worry, as HST apparently has multiple close-cousins with no such restrictions against peering downward.) Despite all these profound differences in perspective, between HST on high, and that garden up north, there are surprising parallels to be drawn.  Particularly as regards our current CANDELS observations of the GOODS-North field. 

Continuous viewing, Hubble-style…

It turns out that HST has its own Continuous Viewing Zone ("CVZ"): specific regions of the sky where, for specific intervals during the year, the Earth never gets in the way, orbit after orbit.  Moreover, the Sun's position in HST's sky is slowly oscillating throughout the year, just like its yearly-oscillating height above and below the polar horizon.  Even better, HST's view of the firmament does not wheel around once per day, like it does for observatories down here on terra firma.  One might suspect that observing targets in Hubble's CVZ would make the most efficient use of HST's precious time, never needing to pause picture-taking because the Earth has blocked the shot.  That pause can be lengthy: typically 40 percent of every orbit suffers from occultation. 

The CVZ efficiency was a prime motivation for deciding the coordinates of the original Hubble Deep Field ("HDF") — 342 separate HST exposures taken during 10 consecutive days in 1995.  The HDF proved to be such a smashing success that the intervening 17 years have witnessed many deep-sky surveys, from a wondrous variety of telescopes on the ground and in space, blossoming all around the HDF.  These include the HST surveys GOODS and now CANDELS. 
 
The CANDELS GOODS-North region is located within Hubble's
northern Continuous Viewing Zone, as shown by this diagram. 
[Credit : NASA]
One of the primary objectives for both GOODS and CANDELS science has been the discovery of supernovae at extreme distances. We find these supernovae by comparing sensitive HST images of the same spot of sky, separated in time by several weeks. Because CANDELS is using a newer, infrared ("IR") light-sensitive camera on Hubble, we can hunt supernovae even farther away than had been possible with GOODS.  The brightening and fading of these cosmic fireworks appear slower with increasing distance, so the cadence of the CANDELS time-lapse photography is longer: 7.5 week intervals, versus 6.5 week intervals for GOODS. 

By happy coincidence, the opportunities for Hubble CVZ observations at the location of CANDELS GOODS-North also recur every 7.5 weeks! Lest you be overcome with irrational exuberance, I will spend the remainder of this post elaborating upon several complexities of our Hubble CVZ observations.  Some are generic to any CVZ-desiring program; some are exceptional headaches for CANDELS.  Surmounting these difficulties is an ongoing challenge, to be sure, but hopefully will prove worthwhile in added science returns from the venture.

Earth never gets in the way, but it is never far from view...

As can be seen from the CVZ orbit diagram above, the geometry is such that Hubble always points along a grazing incidence to the Earth.  In fact, the CVZ orbits flirt with the forbidden zone below 20-degree separation from the daytime Earth limb.  And fully half of every CVZ orbit will be looking past the edge of daytime Earth, with that annoyingly bright sky.  CANDELS is searching for exceedingly faint galaxies and supernovae by stacking multiple long-exposure HST images.  When those images are pointing near to the sunlit Earth, it is akin to midnight stargazing in mid-June Anchorage — an exercise in frustration.  So how does one make effective use of that bonus time in CVZ orbits, then?

Here on the ground, when confronted with an excessively bright sky, people resort to sunglasses that near-completely block the ultraviolet ("UV") portion of the scattered sunlight.  Up on Hubble, the CANDELS team has adopted a nearly opposite solution: during the bright-Earth exposures of our CVZ orbits, we use light-blocking filters that transmit only UV through to the camera.  The intensity of scattered UV light from the daytime Earth is low enough to avoid polluting our long-exposure images of the UV cosmos.  Rather than putting the 40 percent CVZ bonus time into glared-out optical or IR exposures, we obtain a sensitive UV survey complementing our optical/IR survey at no extra cost! 

Continuous Viewing Zone opportunities are not so plentiful...and not so continuous...

When CANDELS was first proposed, our intention was to exploit the matching cadences of the GOODS-North CVZ and the supernovae-searching by conducting ten successive search epochs of 15–16 HST orbits apiece.  The HST Time Allocation Committee approved this strategy, but the implementation quickly ran afoul of the realities of HST scheduling.  In the immortal words paraphrased from Moltke the Elder, "No battle plan survives contact with the enemy." Due to the vagaries of the HST orbit, the windows of opportunity for GOODS-North CVZ have been very narrow in our first few epochs.  Three to four days, tops; sometimes as narrow as two days. Doing the orbits-per-day math with 96 minute orbits (= 14–15 orbits per day), you might conclude that even two days is more than ample for our 15–16 orbit epochs.

Alas, there are several devils-in-the-detail that prevent CANDELS from observing during more than five-ish orbits on a given day, CVZ or otherwise. Foremost among these complications is the forebodingly-named South Atlantic Anomaly, or "SAA".  Unsure why, but this term always reminds me of the paranormal Bermuda Triangle.  Nothing paranormal about the SAA, though, which is much larger, and well to the south.  It is simply the point of closest approach to Earth of the irregularly-shaped Van Allen radiation belts girding our planet.

As you might guess, HST battens down its proverbial hatches every time its orbit passes through, or even near to, this quasi-stationary radiation storm.  The SAA is so large that 7–8 consecutive HST orbits per day are buffeted as the Earth (including the South Atlantic and its Anomaly) rotates underneath.  These SAA-impacted orbits are no good to us: CANDELS has way too much picture-taking jam-packed into every orbit to pause for a radiation storm. 

As for the six-ish remaining orbits per day that are clear sailing, CANDELS must share these together with all other HST observing programs, and HST station-keeping duties.  Amazingly enough, CANDELS is not the only HST observing program with stringent calendar constraints for the HST schedulers to juggle.  The end result is that CANDELS cannot expect all its "CVZ-length" orbits to fit within the available windows — sometimes up to half the orbits spill out.  The silver lining is that GOODS-North CVZ windows are usually lined by a day or two of "almost-CVZ" orbits.  These are still much longer than normal, and perfectly fine for CANDELS.

Snake in the garden…

Despite wanting entirely non-occulted orbits for the fullest amount of UV picture-taking, CANDELS never actually has HST stare at the same spot for more than one orbit. Every new orbit is targeting a new, nearby location, in order to map out an area of sky 15–16 times larger than the HST camera's (small) field of view.  Sliding Hubble's boresight and taking aim at a new target are actions that require several minutes of down-time between picture-taking.  With careful advance planning, we can arrange for this down-time to coincide with occultation, so as not to lose any picture-taking opportunity.  At worst, we need to jettison one of our two nice, long UV exposures to fit these sub-CVZ orbits. 

One noteworthy complication of using close-but-not-quite CVZ orbits is that we need to plan the orbit differently, depending on whether the HST schedulers have slotted us before or after the true-CVZ window.  For CANDELS purposes, all occulted HST orbits are defined to "start" immediately after the prior occultation ends.  For GOODS-North, the orbits immediately preceeding the CVZ window are starting with the bright Earth below, and transitioning over to dark Earth during the orbit.  The exact opposite is the case for orbits immediately following the CVZ window — the orbit starts over dark Earth and ends over bright Earth.

As you may guess, some care is needed with these near-CVZ orbits to ensure the optical/IR exposures and the UV exposures are commanded in the proper order! Hopefully the following diagram may clarify the situation better than another thousand words.  First, a shout-out to CANDELS post-doctoral fellow Marc Rafelski, for creating this highly useful graphical representation of CANDELS CVZ scheduling.  The three panels march along through the hours of one single day: in this case, 22 July 2012.  The undulating ribbon through the middle of the panels is the so-called "limb angle" of the Earth with respect to HST when pointing at our CANDELS GOODS-North region.  Each undulation represents one full orbit of HST around the Earth (taking 96 minutes).  The limb angle cannot dip below 20 degrees, or the target is considered to be occulted by the Earth.  The play of colors along the ribbon may remind you of a poisonous snake in the garden, but is intended to denote bright Earth limb (yellow), dark Earth limb (black), and twilight Earth limb (purple).  You can see that the snake is hacked into many pieces by the Earth occultations (light gray bars) and the SAA passages (salmon-colored bars).  Only the first half of the day is true-CVZ (no occultations), and one of those orbits is spoiled by an SAA passage.  The goal is to precisely align our CANDELS observations with the largely or completely uninterrupted orbits, placing down UV exposures during "day" and optical/IR exposures during "twilight/night".  Toward the end of this particular day, you can see that the occultation zones have grown quite large.  They will remain large until the next GOODS-North CVZ window approaches, in another 7 weeks. 

A day in the life of HST, while pointing at the CANDELS GOODS-North field.  The predicted angle between the Earth limb and HST is plotted over the course of a particular upcoming day in July.  During the first half of this day, there are several opportunities for HST Continuous Viewing Zone observations.  See text, for detailed description.  [Credit : Marc Rafelski]

Timing is everything...and is unpredictable...and is hard to pin down...

As mentioned above, our goal in each CANDELS CVZ orbit is to obtain UV exposures when HST is pointing out across the sunlit Earth, and optical/IR exposures when pointing out across the nighttime Earth.  If we get this wrong, we risk harm to some or all of our bread-and-butter optical/IR exposures by drowning them in glare from the bright Earth.  Minutes count, here. 

Problem 1: the timing of bright-Earth/dark-Earth transitions requires knowing exactly where HST will be, which turns out to be an impossible feat.  You might think that 550 kilometers overhead would qualify as more than "low Earth orbit", but there is actually enough tenuous atmosphere that far up to drag HST very slowly downward.  The drag on HST varies unpredictably based on the wispiness of that thin air, and HST's orientation as it plows on through.  This translates to inherent unpredictability of HST's exact location into the future.  No coincidence that the accuracy is akin to weather forecasting, according to the HST Primer: "For example, the predicted position of the telescope made two days in advance can be off by as much as 30 km from its actual position.  An estimated position 44 days in the future may be off by 4000 km (95% confidence level)." This seems like a vast uncertainty, until one considers that HST merrily rolls along its orbit at 7.5 kilometers per second.  Meaning that our timetable of day/night boundaries may be off by 9 minutes.

For CANDELS CVZ observations, a 9 minute miscalculation is bad news. One, if not two, of our five dark-sky exposures in every orbit will be "scorched" by either starting too early or ending too late.  To best avoid this unpleasantness, with each successive epoch of CANDELS GOODS-North observations we calculate exposure start-times using the most recent HST ephemeris prediction possible before those orbits' exposures must be placed on Hubble's next to-do list.  So far, this labor-intensive, real-time supply chain scheme has worked acceptably well. 

Problem 2: The HST orbit-scheduling juggernaut, which must fit together the jigsaw puzzle of thousands of orbits allocated each year to hundreds of deserving programs, needs to be fitting that puzzle together weeks ahead of actually commanding the telescope to carry out the observations.  This juggernaut is not designed to allow the end-user to lock down orbits' start-times to the minute, particularly when that desired minute is ill-defined in advance.  Fortunately for CANDELS, we have overcome this hurdle by virtue of even-deeper-behind-the-scenes legerdemain from our Program Coordinator, assigned by the Space Telescope Science Institute to ferry our program (and many others) from the drawing board to the telescope commanding. 

I refer curious readers to the Hubble Space Telescope Primer for a more thorough description of these complexities, and for an excellent overall description of HST and best practices for its use.  To conclude this rambling tale, I first cite the dire warning in the HST Primer to those who dare contemplate HST observations in the CVZ:
"There have been cases in the past (e.g. the Hubble Deep Field observations) where optical imaging has been interleaved with other kinds of observations.  However such observations are difficult to schedule and require strong science justification. ... CVZ observations are also generally incompatible with special timing requirements (e.g., timing links, special spacecraft orientations, or targets of opportunity...)."
Naturally, CANDELS is fiddling with all three of these special timing requirements in and around our CVZ observations.  So far, with two out of our ten CVZ epochs completed and the third nearing execution, we have been largely successful in scheduling these complex observations as desired.  Here's hoping that 18 months from now, when all these CANDELS CVZ epochs are completed and the images all stacked together, you will be reading blog posts about the wonderful resulting science and will have long forgotten these behind-the-scenes tribulations.

Friday, July 13, 2012

Growing Black Holes in Teenage Galaxies

About a decade ago, astronomers began to realize that nearly all massive nearby galaxies have supermassive black holes in their centers. Strangely, the mass of this enormous black hole is well-correlated with the total mass of the collection of stars in the inner part of the galaxy: this inner galaxy structure, called the galaxy bulge, is always about 500 times as massive as the supermassive black hole. That is, a galaxy bulge with a mass equal to a billion Suns will have a supermassive black hole with a mass of two million times the mass of the sun.

Both galaxy bulges and supermassive black holes grow with time. Galaxy bulges build up mass by forming stars and merging with other galaxies, and black holes grow in "active galactic nuclei (AGN)" phases by accreting gas, dust, and stars within their event horizons. In order to maintain the observed correlation between their masses, galaxies and their black holes must grow together, with the galaxy bulge always growing around 500 times faster than the black hole. Somehow the black hole and the galaxy "know" about one another as they both grow.

This leads to an interesting "chicken or egg" question: which comes first, the galaxy or the black hole? Do tiny young galaxies in the distant past already have growing black holes? Or is the close link between galaxies and their black holes only a recent development?

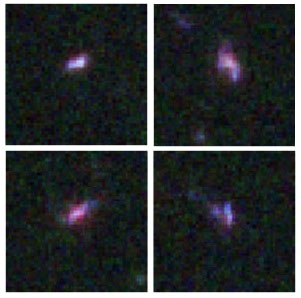
Four examples of adolescent, low-mass galaxies in 
CANDELS which host growing AGNs. Image credit:
A. Koekemoer, Space Telescope Science Institute 
Several of us decided to use CANDELS to solve these questions. As it turns out, we found that low-mass galaxies do indeed already host growing AGNs when the universe was only in its teenage years (at about redshift two)! Only the tremendously deep HST images of CANDELS made it possible to find such faint and low-mass galaxies when the universe was less than a billion years old (compared to its current age of 13.7 billion years). And finding evidence of growing black holes was even harder! Just as the local galaxy - black hole mass correlation tells us, these low-mass galaxies have even smaller black holes.

To find the black holes, we had to combine the deep CANDELS imaging with the unique HST infrared grism spectroscopy in the same field. The HST grism is unique because it provides both spectral information and spatial data. So the grism not only disperses the light from a galaxy into a spectral rainbow, but it also allows us to compare an inner galaxy spectrum with the outer spectrum of the same galaxy. This is particularly useful for finding AGNs, which tend to strongly affect the interior of a galaxy without changing the outer region too much.

Accretion onto a black hole produces much more UV and X-ray emission than typical galaxy starlight. High-energy photons are very efficient at ionizing atoms, producing a tell-tale emission line signature in a spectrum. Because AGNs live in the centers of galaxies, they cause a markedly different ionization signature in a galaxy's interior compared to its outer region -- and the CANDELS grism data revealed this very feature in several distant and low-mass galaxies.

Four examples of these teenage galaxies with growing black holes are shown in the graphic above. As you can see, they look like barely-detected smudgy little disks. They are particularly interesting because they don't seem to have the bulge structure seen in the centers of local galaxies with growing AGNs. It seems that we've determined that the black hole "egg" actually comes before the galaxy bulge "chicken!" And it's a testament to the tremendously deep CANDELS imaging and spectroscopy that we can learn about growing black holes in such faint teenage galaxies.

Wednesday, July 11, 2012

Smooth Stellar Mass Maps, and the Nature and Fate of Star-forming Clumps

If I have seen further it is by standing on ye sholders of Giants.”  Written in 1676 and signed Sir Isaac Newton, these famous words are applicable to any scientific endeavor undertaken ever since, however ambitious or incremental.
Today’s news flash on a recently published CANDELS paper by myself and collaborators features three such metaphorical giants. The first one has an extraordinary sharp eye, but unfortunately suffers from color blindness. The second senses a rainbow of colors, from bluer than blue to redder than red, but his blurred vision reduces the most beautiful structures to a fuzzy, featureless blob. Finally, the third giant combines the virtues of the first two, but is hampered by tunnel vision, allowing him to inspect only few galaxies at a time.
For years, Giant One has been telling his brothers how, as he looked at ever more distant galaxies, they appear clumpier and more irregular in his black-and-white snapshots than their local counterparts.  This led to speculations about more abundant collisions between galaxies, as well as other processes that could wreck their appearance and may be more prevalent in the early universe.  For instance, distant galaxies are known to be more gas rich, and theory predicts that under these conditions instabilities in the gas disk can give rise to clump formation.  
Meanwhile, Giant Two developed the tools to translate his colorful yet blurry visions of distant galaxies to physical characteristics: the mass in stars hosted by the galaxy, their age, and the rate at which new stars are being formed.  Giant Three raised the concern that color variations, tell-tale signs of a diversity in stellar populations, may be present not only among a population of galaxies, but also spatially within individual galaxies.  However, he lacked the statistics to address his concerns in a systematic way.

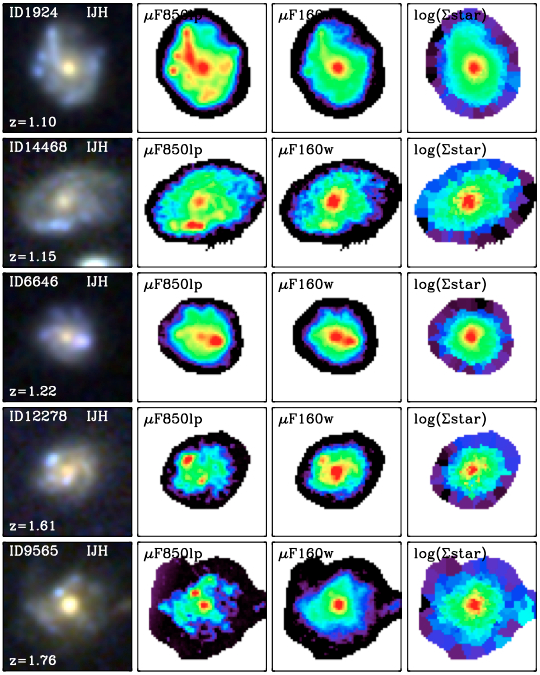
Star-forming galaxies featuring clumpy light distributions, 
yet smooth stellar mass maps.  From left to right: color image, 
blue light distribution,  red light distribution, stellar mass map.
(credit: Stijn Wuyts)
Enter CANDELS.  With the power of Hubble’s ACS and WFC3 cameras, we combine the virtues of the giants without any of their handicaps.  In our latest study, we look 5 to 11 billion years back in time, and construct a large and complete sample of 650 massive star-forming galaxies.  For each of them, we measure the resolved light distribution in as many as seven wavebands.  Interestingly, Giant Three’s concerns seem validated: spatial color variations are indeed seen across the face of distant galaxies.  Typically, the clumps are bluer than the underlying disk, and the reddest colors are found in the center.  Applying the tools developed by Giant Two, we translate the color information of each pixel to physical quantities, and reconstruct for the first time maps of the stellar mass, rate of star formation, and age within large samples of early star-forming galaxies.
One striking trend immediately caught our attention when inspecting the mass maps: they appear more concentrated and smoother than the light distributions, particularly than those measured at short wavelengths.  The difference in concentration can be understood from the fact that dust, when present, generally obscures more light in the center than in the outskirts.  When the galaxy has old stars, contributing significantly to the mass but less so to the light, they also tend to reside in the center, leading to the same effect.  The remarkable smoothness in mass is a blow to the concept that large fractions of distant galaxies are undergoing collisions.  Such collisions would not only wreck the light but also the mass distribution.  While off-center clumps seen in light are not prominent in the mass maps, they stand out as short-lived vigorously star-forming regions, hosting younger stars than the underlying disk.   

Why only young clumps are seen at large radii remains an unsolved puzzle, and a source of heated debate among theorists and observers alike. One group of theorists advocates a scenario in which clumps migrate inward very efficiently, where they contribute to building up a central bulge. A competing group argues that supernova explosions and radiation from massive, bright stars drive strong outflows that quickly disrupt the star-forming clumps, hence limiting their lifetimes. Upcoming analyses of CANDELS data and spectral diagnostics in concert promise to untie the knot.

Monday, July 9, 2012

UDS: The Ultra Deep Survey

This post is the third in a series of posts describing the five fields being targeted by CANDELS and is focused on the Ultra Deep Survey. Our previous posts described the GOODS-North and -South fields and COSMOS.

It's probably fair to say that the Ultra Deep Survey (UDS) is the least well known of the five survey fields that are now being targeted by CANDELS. However, even before the start of the CANDELS program, the UDS featured the deepest near-infrared (near-IR) imaging of any wide-area survey and was a premier field for studying the evolution of massive galaxies in the distant Universe. In fact, the UDS field has a rich history, extending back more than a decade and, as is often the case in astronomy, tends to be known by different names, depending on what wavelength of light you happen to be working with. When we refer to the field as the UDS, we are specifically referring to a near-IR imaging program (Principal Investigator: Omar Almaini, University of Nottingham) which has been pursued by the United Kingdom Infrared Telescope (UKIRT) in Hawaii for the last seven years. Given that CANDELS itself is fundamentally a near-IR imaging survey, before discussing the UDS in detail, it is perhaps worthwhile considering why observing galaxies in the near-IR part of the electromagnetic spectrum is such a powerful technique.


Left: The UK Infrared Telescope (UKIRT) on Mauna Kea, Hawaii. Right: The Wide-Field Camera (WFCAM) which is being used to observe the Ultra Deep Survey (along with four other major surveys). Image credit: Joint Astronomy Center, Hawaii

One of the key goals of extra-galactic astronomy is to try to obtain a full understanding of the formation and evolution of the most massive galaxies in the Universe. This goal is fundamental because most stars in the Universe eventually end up in massive galaxies and the evolution of the most massive galaxies has traditionally been the most difficult to accurately describe within the framework of theoretical models. Consequently, the optical properties of massive galaxies in the relatively nearby Universe have been the subject of intense study for many decades.

However, in order to gain a better understanding of galaxy evolution it is clearly necessary to investigate how the galaxies evolve as a function of cosmic time. It is within this context that observations in the near-IR (wavelengths of 1.0-2.5 microns, just long-ward of where the human eye loses sensitivity at about 0.7 microns) are key. In fact, observations in the near-IR have numerous advantages (and disadvantages), but two strengths of near-IR imaging are particularly relevant here.

The first key advantage of near-IR observations is that they allow us to study the optical properties of very distant galaxies.  As we observe galaxies at greater and greater distances, the light emitted by these distant galaxies is stretched, or "redshifted" in the jargon, during its journey towards us due to the continued expansion of the Universe. In fact, because redshift (denoted by the letter "z")  is directly related to distance, astronomers invariably refer to galaxies as being "at redshift z=1", rather than at a distance of so many billion light years. Due to the redshifting effect, the ultra-violet (UV) and optical light emitted by distant galaxies is shifted towards the near-IR part of the electromagnetic spectrum. Consequently, by observing distant galaxies in the near-IR we can actually study their optical properties, and therefore compare them on an equal basis with galaxies observed in the local Universe. The second key advantage of near-IR observations is that they allow astronomers to get a much more accurate measurement of the stellar mass of a galaxy, because near-IR luminosity is a much better tracer of stellar mass than optical/UV light.  The straightforward reason for this is that near-IR light is dominated by the low-mass, long-lived, stars that actually account for the bulk of a galaxy's mass. In contrast, if a galaxy is undergoing star-formation, optical (and particularly UV) light can be dominated by very massive/luminous short-lived stars which, although spectacular, only account for a small percentage of the total stellar mass.

These two key properties of near-IR observations were the primary drivers behind the first generation of near-IR surveys which were undertaken about a decade ago. Perhaps the key result from these early near-IR surveys was that, unexpectedly at the time, at a redshift of z=1 (at which point the Universe was basically half its current age) a large fraction of the most massive galaxies (galaxies containing the same stellar mass as 100 billion stars like our Sun) where already in existence. However, if you push your observations further back in time, out to perhaps a redshift of z=3 (when the Universe was only 15% of its current age), you find that only a small fraction of the massive galaxies we observe locally already existed at this earlier epoch. Consequently, it became clear that the 3.5 billion years of history contained within the redshift interval 1<z<3 constitutes the "epoch of massive galaxy assembly", during which the vast majority of the massive galaxies we observe in the local Universe were formed. The primary motivation for the Ultra Deep Survey was to study this key epoch in the evolution of the Universe.

A cluster of massive galaxies discovered using a combination 
of the X-ray, optical, near-IR and mid-IR data in the UDS. The 
galaxy cluster (concentration of red objects in the center of the 
image) is at redshift z=1.6, an epoch when the Universe was only 
30% of its present age. Image credit: NASA/JPL-Caltech/
C. Papovich (Texas A&M University).
The Ultra-Deep Survey (UDS) is actually just one of five surveys being pursued by the United Kingdom Infrared Telescope (UKIRT), using a dedicated, wide-field, near-IR survey camera (WFCAM).  As is nearly always the case these days (and is certainly true for CANDELS), the near-IR surveys conducted by UKIRT form a so-called "wedding cake" structure, which describes the arrangement of increasing sky coverage, but decreasing sensitivity, as you proceed from top-to-bottom of the wedding cake.  Covering a sky area of 0.8 square degrees, the UDS forms the top layer of the wedding cake, covering the smallest area of sky, but with the necessary sensitivity to detect and study galaxies in the very distant Universe.

As a result of the huge investment of observing time necessary to build-up any large-scale multi-wavelength survey field, the observations are always obtained over a number of years. Consequently, the same area of sky tends to end-up being referred to by a confusing number of different names and acronyms. This is certainly the case for the UDS.  The original dataset which initiated everything else consists of deep X-ray observations by the XMM-Newton X-ray satellite, taken as part of the so-called XMM Large Scale Survey (XMM-LSS). Subsequently, very sensitive optical imaging was taken within the same area by the 8m-class Subaru telescope in Hawaii which, together with the existing X-ray imaging, formed the Subaru XMM Deep Survey (SXDS). The near-IR observations with WFCAM that constitute the UDS were then located in the middle of the SXDS in order to take full advantage of the existing optical and X-ray imaging.

In addition to the existing data, another crucial aspect of the location of the UDS is the fact that it is an equatorial survey field. This simply means that it is located close to the celestial equator (the projection of the Earth's equator onto the celestial sphere) and as such, is within the overlap region which can be readily observed by telescopes situated in both the northern and southern hemispheres. This is a key advantage because it means that the world's most powerful telescopes, which are mostly either located on Hawaii in the north or in Chile in the south, can all contribute to building-up the necessary database of multi-wavelength imaging and spectroscopy.

Indeed, over the last decade the archive of multi-wavelength data in the UDS has become enormous, spanning wavelengths from high energy X-rays at one extreme, to ultra-sensitive radio data at the other (more details of multi-wavelength data available in the UDS can be found on the
UDS website). In addition to the imaging and spectroscopy contributed by some of the world's most powerful ground-based telescopes (i.e., Subaru, VLT, UKIRT), many of the key datasets in the UDS have been delivered by space-based observatories. In addition to the original X-ray data from the XMM-Newton satellite, the UDS has been imaged in the UV with the GALEX satellite, in the mid-IR with the Spitzer satellite and now, with the advent of CANDELS, at high-spatial resolution in the near-IR with the Hubble Space Telescope (HST).

A true-colour image of the Ultra Deep Survey field. The zoom-in shows the location of a galaxy at redshift z=6 (red arrow), identified at an epoch when the Universe was only 5% of its present age. Image credit: Omar Almaini, Nottingham University (P.I. of UDS)

Armed with this impressive archive of multi-wavelength data, many astronomy groups around the world are now exploiting the UDS to tackle the outstanding issues of galaxy evolution. In the past few years, much work has been done to address the key science goals which originally motivated the UDS, exploring how the number densities, luminosities, stellar masses, sizes and morphologies of massive galaxies evolve as a function of cosmic time. Moreover, the UDS dataset has been used extensively to study how massive galaxies cluster together, both on small and large scales, and how their clustering is linked to the properties of the dark matter halos in which they reside. Interestingly, out-with the original science goals, the UDS dataset has also been extensively used (including by this author) to push the study of massive galaxies back into the early history of the Universe at redshifts of z>6, when the Universe was only 5% of its current age.

In this context, the availability of HST imaging from CANDELS offers the prospect of hugely enhancing the power of the UDS dataset for pursuing  detailed studies of galaxy evolution at high redshift. The unrivalled sensitivity and sharpness of the near-IR imaging provided by HST will allow the properties of galaxies to be studied in detail at much larger distances than was previously possible. As a consequence, in combination with the vast array of data already assembled, the HST imaging provided by CANDELS promises to secure the position of the UDS as a leading resource for the study of galaxy evolution for many years to come.

Friday, July 6, 2012

CANDELS Spectroscopy: The Infrared Grism

Many people think of Hubble as a telescope that primarily takes striking high-resolution images; and most astronomers think of the CANDELS project as a deep imaging survey. However, Hubble also has a strong capability for spectroscopy, dispersing the light from astronomical objects as a function of wavelength to measure features in the spectrum, and the CANDELS survey itself also has a spectroscopic component. Hubble's main spectroscopic capability is at ultraviolet (UV) wavelengths, unique because ground based telescopes cannot see UV, as it is blocked by the atmosphere. But CANDELS spectroscopy, like the backbone of our imaging, is in the near-infrared, and that's what this post is about.

CANDELS imaging covers contiguous areas that are relatively large for HST, tiling many fields together, but the spectroscopy is in smaller fields, one at a time. Why? The primary goal of the spectroscopic program is to follow up high redshift supernovae, an effort led by Adam Riess and Steve Rodney. CANDELS discovers supernovae by comparing images taken about two months apart, looking for the appearance of new point sources, caused by exploding stars in distant galaxies. Some of these sources are at high redshift, and some have colors consistent with Type Ia supernovae, caused by the explosion of an overloaded, collapsing white dwarf. These are very useful as a measure of distance, one of the cornerstones of the evidence for the accelerating universe and dark energy

But the supernovae and their host galaxies are very faint and difficult to follow up with ground based spectroscopy. We take grism spectra to attempt to measure the redshifts of the host galaxies, and to get spectra of the supernova, where in the best cases we can measure spectral features to determine if they are really Type Ia, exploding white dwarfs, rather than exploding massive stars. As a side result, we get spectra with the grism for most other galaxies in the Hubble field of view, and that is scientifically very useful in its own right. (Although CANDELS spectroscopy follows up supernovae one pointing at a time with relatively long exposures, there are separate Hubble grism programs that cover most of the CANDELS fields with shorter exposures, one led by me - AGHAST, and one led by Pieter van Dokkum at Yale University - 3D-HST).


How a grism works: a combination of a diffraction grating to spread out the wavelengths of light, and a prism to direct the rays back into the rest of the camera so we can see them. Image Credit: Benjamin Weiner

What is a grism, anyway, and how do we get spectra for a few hundred objects at a time? "Grism" is a word used mostly by astronomers, and it simply means a combination of a diffraction grating and a prism. Both are used to disperse light, bending it as a function of wavelength, like a prism you may have used to project sunlight into a rainbow on the wall. The grism is inserted into Hubble's Wide Field Camera 3 (WFC3) - Infrared instrument, where ordinarily a filter would go to make images in a broad range of infrared wavelengths. The grating is a series of parallel ridges deposited on the glass surface of the prism; the grating disperses the light at an angle that spreads out the wavelengths, and the prism bends that bundle of rays back so it goes straight into the rest of the camera, making an image on the detector. The image of a galaxy through a normal filter looks like a galaxy, but the image made through the grism is a spread-out spectrum, just like that rainbow on your wall is a spread-out spectrum of the Sun.

Because the grism is in the light path just like a filter, the image made with a Hubble WFC3 grism has a dispersed spectrum for everything in the field of view. That's both a strength and a weakness. It means that one exposure gets spectra for many objects, but also that the spectra sometimes overlap, and that the light of the night sky also falls on all of the detector. This is why the infrared grisms on Hubble are uniquely efficient. From the ground, the atmosphere emits bright infrared radiation that would clobber any signal from galaxies and stars, and we have to get around this by using entrance slits in spectrographs to block most of the skylight. In orbit, the infrared background that Hubble sees is much lower (it's mostly from the zodiacal dust cloud), which allows Hubble to do "slitless" grism observations, getting spectra for many objects at once without the complexity of mechanically adjustable slits.

A section of a CANDELS grism observation, with the regular imaging on the left and the grism spectra on the right. The grayscale is reversed, so bright galaxies appear dark. For each galaxy on the left that is bright enough, there is a spectrum on the right. Some show bright spots, which are emission lines. (For the experts, many of the bright spots are true emission lines, but a few are undispersed images of very bright objects.) Image Credit: Benjamin Weiner
The spectra of galaxies and stars are valuable for doing astrophysics, because they reveal features at discrete wavelengths, called absorption and emission lines. These are features from stars and from hot gas heated by young stars - the emission from hot gas comes out at discrete wavelengths, like the light from the gas in a neon sign. These can be used to measure a galaxy's redshift, or how far away it is, and the strengths of the lines tell us about the physical conditions in the stars and gas, from which we infer many facts about distant galaxies. In the 1860s, Gustav Kirchhoff and Robert Bunsen used absorption lines found in the spectra of the Sun (and later in other stars) to show that the Sun and stars are made of the same elements that exist on Earth; this was essentially the birth of astrophysics, and it still boggles my mind that we have only known this for 150 years.


With the grism, instead of a field of galaxy images, we see a field of galaxy spectra, running from blue to red, or for CANDELS, from infrared to more infrared.  This means we get many spectra at once, although sometimes they overlap. When a galaxy has strong emission at a single wavelength, we see a bright spot in the spectrum. Image Credit: Benjamin Weiner
In grism data, the spectrum of a galaxy looks like a streak because the light is spread out in wavelength. An emission line shows up as a bright dot on that streak, a lot of light at a single wavelength. By identifying these lines, measuring the wavelengths and comparing to their known wavelengths at rest, we can get the galaxy's redshift. The distance then allows us to compute its true brightness. Because each grism exposure includes the spectra of many galaxies, we can get many redshifts - sometimes over a hundred - in a single HST pointing. This is great for us, although it also makes a lot of work to visually inspect all the spectra! The large numbers of redshifts also allow us to measure which galaxies are in densely or sparsely populated environments.


A zoomed in view of part of the grism image above. Each streak is a 
spectrum, and I've drawn green circles around some of the noticeable 
emission lines. Image Credit: Benjamin Weiner

Another strength of the WFC3-IR grism is that it gives us spectra in the near-infrared, beyond 1 micron. It's been difficult to take large numbers spectra from the ground in the infrared due to the sky brightness. The near-infrared is particularly interesting because for distant galaxies, the redshift moves their strongest emission lines from optical wavelengths into the near-IR. The WFC3-IR grism data are good for measuring emission from galaxies at redshifts 1-2, or when the universe was about a half to a quarter of its present age. 

We use the strength of emission lines, mostly from ionized hydrogen and oxygen, to understand the nature of galaxies at this long-ago epoch. The strength of the lines and the ratios of their intensities are a probe of the amount of star formation in a galaxy, the amount of metals that have been formed by stars and ejected back into the interstellar gas, and whether the gas is being ionized primarily by ultraviolet light from young stars, or from an active nucleus - a massive black hole. So far, CANDELS has used this data in a couple of papers that look at very young star forming galaxies with strong emission lines (see Arjen van der Wel's post), and there will be more to come.

Wednesday, July 4, 2012

COSMOS: The Cosmic Evolution Survey

This post is the second in a series of posts that tour the five CANDELS fields. Our previous post discussed the GOODS-North and -South fields. This one focuses on COSMOS and is a joint post written by Jeyhan Kartaltepe and Mara Salvato.

"It will be like being on the Moon and being able to recognize buildings in New York and trucks on Broadway."

It was with these words in 2003 at a conference in Venice that Nicholas Scoville, from the California Institute of Technology, Principal Investigator of COSMOS (the Cosmic Evolution Survey) informed the scientific community that the Advanced Camera for Surveys (ACS) on board the Hubble Space Telescope (HST) would image a contiguous two square degree area of the sky. Before CANDELS, COSMOS was the largest HST project ever approved and the COSMOS field remains the largest area of the sky ever surveyed by Hubble. To put this in context, two square degrees is 16 times the size of the full Moon and about 25 times the size of the GOODS fields. 

Illustration of the COSMOS field (right) relative to the full moon and the
GEMS, GOODS, and HUDF fields. Image credit: NASA, ESA, and Z. Levay
Since this was a brand new survey, without a history of observations from other telescopes, astronomers from all over the world began to point the eyes of every major astronomical facility on the ground (using telescopes in Hawaii, Arizona, New Mexico, and Chile), and from space (including the Galaxy Evolution Explorer (GALEX), the Spitzer Space Telescope, the Herschel Space Observatory, the Chandra X-ray Observatory, and the XMM-Newton satellite) in the direction of the COSMOS field to complement the exquisite HST imaging. This huge effort has resulted in COSMOS having one of the largest, deepest, and most uniform data sets across the entire electromagnetic spectrum, from the X-ray to the radio. Today the COSMOS field is one of the best-studied regions of the sky with an incredible archive of data available to the public. In addition, because of the location of the COSMOS field on the sky (it is equatorial), it will always be accessible by future facilities because it is visible from both the northern and southern hemispheres. This means that COSMOS will be one of the first places any new telescope will look -- indeed, plans are already in the works for surveys with ALMA, the J-VLA, and the LMT.

Detailed 3-dimensional map of the dark matter distribution in the
COSMOS field. Image Credit: Modified from NASA, ESA, R. Massey
(California Institute of Technology)
One of the main drivers of surveying such a large contiguous area of the sky with Hubble was to study the effects of large scale structure, or the cosmic web of galaxies and groups of galaxies called clusters. In many smaller area surveys, one can happen to land in a particularly dense area of the sky (on a galaxy group or cluster) or in an underdense area of the sky (on a void) and have a difficult time understanding how various galaxy properties relate to the environment in which they happen to be in. What properties are universal and what properties are affected by being in such close proximity to other galaxies? This structure can make it difficult for astronomers to determine which measurements they make are statistically representative of the entire universe, and which ones just happen to be the case in the small area they are looking at. This problem is known as cosmic variance and can be an issue for many astronomical surveys. By surveying a large area of the sky, COSMOS is able to probe a wide range of environments, from relatively empty areas, to galaxy groups and clusters, and thus mitigate the effects of cosmic variance. In addition, astronomers are able to use this data set to study how various galaxy properties relate to environment. One of the most exciting and widely publicized results from COSMOS was the ability to map the large scale structure of the COSMOS field, and thus the distribution of dark matter, in three dimensions using a technique called "weak gravitational lensing".

A large survey like COSMOS has another important advantage - numbers! There are a lot of galaxies in two square degrees of the sky - over two million identified from the optical data alone. Of these, we have accurate distance measurements (redshifts) to over 25,000 galaxies. We can use these to train tools used to estimate distances for the remaining objects. With this many galaxies, we can address many important questions in a statistical way with large samples of objects. This is especially important when studying the distant universe - at high redshift, COSMOS probes a volume of space that is comparable to that of surveys in the local universe, such as the Sloan Digital Sky Survey. This has enabled many robust galaxy evolution studies, such as understanding how frequent galaxy mergers and interactions have been over cosmic time. A large survey area also allows us to find very rare objects in the universe that would be unlikely to be found in a smaller area. For example, a candidate recoiling black hole was recently identified. This object was so unique and intriguing, it really captured the public's imagination!

Two Square Degrees: Piece by Karel Nel, inspired by the
COSMOS field. Credit: Karel Nel
One of the most unique aspects of COSMOS is that one of the team members, Karel Nel of the University of Witwatersrand in Johannesburgh, South Africa, is an artist who has learned about astronomy over the years through other members of the collaboration and by attending team meetings. This has inspired Karel's art work, and his pieces based on COSMOS have appeared in a number of art exhibits around the world, including the newly opened African Cosmos: Stellar Arts exhibit at the Smithsonian Museum of African Art in Washington, D.C.

COSMOS has produced many scientific papers and interesting science results, from members of the collaboration itself, as well as from other astronomers who made use of the publicly available data set. We have highlighted only a few of them here. All of these factors made the COSMOS field a clear choice for a survey with Wide Field Camera 3 (WFC3) as part of CANDELS. A portion of the COSMOS field is one of the key fields for the CANDELS wide area survey. The CANDELS observations of the COSMOS field now been completed and the analysis has just begun. Stay tuned for future blog posts about CANDELS science in the COSMOS field!

Monday, July 2, 2012

Baby Galaxies in the Distant Universe

A newborn baby will typically double its weight in about 4 months. Imagine an adult growing at an equally monstrous rate! Galaxies are like people in that they also grow fast when they are young, and slowly when they are old. This post is about baby galaxies discovered by CANDELS that we found to be forming stars at a ferocious rate when the universe was 4 billion years old.

Let us do a little thought experiment and scale the life time of galaxies -- essentially, the age of the universe (13.7 billion years) -- to the life span of a human (say, 80 years). The CANDELS baby galaxies are, on this scale, about a month old and will double their mass in stars by the end of the second month. In comparison, our Milky Way Galaxy would, at its current rate, double its mass in about 80 years, not too different from the current growth rate of the average weight of people in a rich country, I'm afraid.

Like their human counterparts, these baby galaxies consume vast amounts of fuel relative to their weight. This fuel consists of gas that is very simple in its composition, with a very low level of contamination in the form of elements heavier than Helium. Out of this pristine gas the galaxies form new stars continuously, quickly building up their stellar bodies.


The largest and hottest among the millions of newly formed stars dominate the energy budget of an entire galaxy. It is their energy output that we observed with CANDELS, in particular because they ionize gas which subsequently recombines and emits an enormous amount of light at a single wavelength. This line radiation makes these unexpected objects stand out among the thousands of older, more slowly growing 'kid' galaxies seen by CANDELS in the distant, that is, younger, universe, much like a crying infant is easily recognized in a crowd of gossiping teenagers.


Especially when the large, hot stars reach the end of their lives, when they explode as supernovae -- on our human time scale, these stars do not grow older than a couple of weeks, the price they pay for their fast-paced life styles -- they generate a lot of mayhem. Much of the present gas is blown out of the galaxy, making its immediate environment acutely aware of its digestive prodigiousness.

The number of baby galaxies we observed suggests that the age of the universe when it was giving birth to the observed baby galaxies is a healthy 23 years on our human time scale. (How such a young universe had already given birth to thousands of teenager galaxies is food for a discussion that we will have at some other time.) Interestingly, it was around the same time that the universe as a whole was producing new stars at the highest rate it ever would. 

At the present day, that rate is about a factor 10 smaller. The baby galaxies, in particular, are not produced in any significant number today. Even though rare examples are known, the incidence of such strongly star forming baby galaxies in the younger universe was at least 100 times larger than it is today. This commonness at earlier times is precisely one of the most interesting features. We see galaxies form their first significant batch of stars, in a way that was not anticipated or predicted by our galaxy formation models. Much work is still ahead of us to find out what causes the high star formation rate and what role these objects play in the big picture of galaxy formation. 

CANDELS has allowed us to find this new class of distant galaxies, which has already instigated much discussion and will certainly motivate further investigations. Perhaps the most pressing question is, as always, what these baby galaxies will grow up to become. Will their unhealthy growth result in their own demise, or will they settle for a more sustainable growth level and lead steady lives for many decades?