Showing posts with label Janine Pforr. Show all posts

Monday, February 8, 2016

The VIMOS UltraDeep Survey – a spectroscopic survey of high redshift galaxies


The VIMOS UltraDeep Survey (short: VUDS) is an observational program to gain spectroscopic measurements for ~10,000 galaxies at high redshift, when the Universe was only between 1- 3 billion years old (today, the Universe is 13.8 billion years old). This is a particularly interesting era to study in terms of galaxy evolution since astronomers expect galaxies at that epoch to look very different from today. For example, at that early time we observe that galaxies have a much more disturbed morphology compared to the beautiful structured spiral galaxies or smooth elliptical galaxies that we see in the local Universe. We expect that galaxies formed many more stars at that time partly triggered by disturbances from the merging of galaxies but also because more gas was still available to form stars in those galaxies. The time between redshift 2 to 6 (i.e. the first 1-3 billion years of the Universe’s age) is thus a major epoch of galaxy assembly.

Figure 1: Very Large Telescope in Chile, photo credit: R. Thomas.
With CANDELS, galaxies in that epoch are studied mostly based on photometry, meaning images taken at different wavelengths. We described in earlier blog posts how with photometry at many different wavelengths astronomers are able to study the properties of galaxies through comparing the observed data to model galaxy spectra.

With VUDS galaxy evolution is approached from the spectroscopic side. A spectrum of an object is created by dispersing all its emitted light by directing it through a disperser like a prism, meaning the light is split up according to its wavelength. An easy example is the creation of a rainbow where the light from the sun hits raindrops in the air which act as dispersers and split the originally "white" sunlight up by wavelength, creating the typical coloured stripes. Such spectra allow us to study the properties of galaxies in much more detail compared to the study of images alone. 

The VUDS survey covers about 1 square degree in the sky. As a comparison the diameter of the full moon is about 0.5 degrees and its area is ~0.2 square degrees, which means it’s a fifth of the area covered by the VUDS survey. However, this 1 square degree of area of the VUDS survey is split over 3 separate fields in the sky that have been observed with a lot of different instruments and at many wavelengths already, creating a unique and precious data set for astronomers to carry out their studies. The three fields are the COSMOS field (which overlaps with the CANDELS-COSMOS field), the Extended-Chandra Deep Field South (which overlaps with the CANDELS-GOODS-South field) and the VVDS-2h field. Within those 3 fields spectra of ~10,000 galaxies were taken with the VIMOS multi-object spectrograph at the Very Large Telescope (VLT) in Chile (Figure 1). We described how multi-object spectroscopy works in more detail in this recent post. In short, suffice it to say that with that instrument, astronomers are able to take a spectrum of many galaxies at the same time. VUDS is the largest spectroscopic survey of galaxies at these early cosmic times.

Two of the 3 fields covered by VUDS overlap with the CANDELS area. The spectra and spectroscopic redshifts in that overlap area (~ 700 galaxies) were just publicly released by the VUDS team.

Figure 2: Stacked spectrum of galaxies between redshift 3 to 4 with the most reliable spectroscopic redshifts in VUDS. Vertical dashed lines indicate known spectral lines which are used to determine spectroscopic redshift and galaxy properties.

For the VUDS survey, the objects which were targeted for the spectroscopy, were selected primarily based on their redshift as derived purely from photometry (again, see this blog post here). Additionally, some sources were added based on their photometric colours (i.e. the difference in brightness between two wavelength bands) which indicate a high redshift. These objects were then observed with two different grisms -- one for the blue wavelength end and one for the red wavelength end – for about 14 hours each. The resulting spectra cover a wavelength range from the blue optical to the very red optical. This means that for these high-redshift galaxies, we really observed their ultra-violet to blue optical wavelength range which are shifted due to the redshift into the optical wavelength range covered by the VIMOS instrument. This wavelength range reveals many properties of galaxies, especially with regard to their star formation. In Figure 2 we show you a stacked spectrum of some VUDS sources in which also the spectral lines are indicated. In Figure 3 you can see all the spectra of the VUDS survey compiled into a picture and sorted by redshift, where each line represents one spectrum. Emission and absorption lines in this image are nicely visible in this as bright and dark lines that stretch across the image from left bottom to top right. This also illustrates how spectral features are redshifted towards redder wavelengths. The most common spectral lines and features in these spectra are the Hydrogen Lyman-alpha, Lyman-beta and Lyman-gamma lines, the Lyman limit (below which almost all emission is absorbed by neutral Hydrogen around newly formed stars), the Carbon lines (CII, CIII and CIV, where the Roman numbers behind the letters indicate the ionization level of the element) and lines from Helium (He), Oxygen (O), Silicon (Si) and Aluminium (Al). These lines are used not only to determine the spectroscopic redshift of these galaxies (i.e., through their known rest-frame wavelength), but also other galaxy properties such as star formation and chemical composition of the galaxies. Overall in VUDS we were able to determine reliable spectroscopic redshifts for ~6000 galaxies which cover a large range of brightnesses and stellar masses. Some of the galaxies in this survey form up to 1000 solar masses per year!

Figure 3: Compilation of each spectrum taken in the VIMOS UltraDeep Survey and sorted by redshift. Redshift increases from the bottom to the top, meaning the further up in the image we go, the further into the past we look and the younger the Universe is. Marked are spectral emission (bright spots in the spectrum) and absorption lines (faint spots in the spectrum) at each redshift. This figure illustrates nicely how certain spectral features seem to be present in galaxies in this survey at the various redshifts and thus across cosmic time. Figure from Le Fevre et al. 2015, A&A 576, A79
Since the completion of the observations, many researchers in the international VUDS team work on all aspects of galaxy formation and evolution, from morphology to identifying proto-galaxy-clusters and groups, from studying the ultra-violet spectroscopic properties of very young galaxies to the merging history of the Universe, in alignment with the science goals of the overall survey. If you are interested in following the results from the VUDS survey, you can find our Facebook page here and our Twitter account here.

Thursday, November 19, 2015

Preparing Multi Object Spectroscopy Observations

Although CANDELS is a photometric survey, many team members have proposed for and been granted observing time for CANDELS sources to obtain spectroscopy. Such additional data not only provides us with a more accurate measurement of the distances of galaxies (aka redshift), but also with additional information to decode their properties, such as how many stars they are forming and how much dust is contained in the galaxies.

Figure 1: Example pointing for a MOS observation with the GMOS
instrument at the Gemini Telescope. The image in the background shows
the targeted sky area. The cyan outline shows the field of view of the
instrument with the gaps between the 3 CCD detectors. The dashed outlined
box shows the sky area in which the guide star needs to be placed. The red
"arm" shows the arm that holds the camera that monitors the guide star.

Classically, spectroscopy was carried out object by object, by placing one long slit where your one object is located. With this you restrict the area which lets light through to the detector to a narrow slit and blocking out everything else around it. The light that enters the prism or grism through this slit is then dispersed according to its wavelength, creating a spectrum of the object. Bright spots highlight the presence of elements that emit at this frequency/wavelength, and dark spots tell us where certain elements absorbed light and stopped it from reaching us. You can imagine though that carrying out such observations object by object is very time consuming.


In the last decades though, astronomical studies for galaxy evolution started to greatly profit from new instrumentation which allows us to observe many objects at the same time. This is not only true for taking images of the sky, but also for spectroscopic observations.

One method to take spectroscopy of many objects at the same time is grism spectroscopy, which we showed you in our post about grism spectroscopy with the Hubble Space Telescope. In that case nothing in your field of view is masked out and everything is dispersed. If your field of view is very crowded, meaning you have many many objects in your piece of sky, many spectra will overlap and will be hard to disentangle.

Figure 2: I-band image of the piece of sky to be observed with Multi Object
Spectroscopy within the mask-making software. The red outline shows the
field of view of the instrument, the blue stripes mark the gaps between the
detectors. All potential target objects are marked with different smaller
symbols according to their priority (blue triangles, green boxes, white circles
and cyan diamonds for alignment stars).
Another method is multi-object spectroscopy (MOS) via slit-masks. With this method you can take spectra for many objects at the same time by placing slits on many objects and blocking out the rest of the sky. This requires the creation of so-called MOS-masks in which the slit areas and the blocked out areas are clearly defined. This means that for every different observation you need a custom mask. Most current instruments require these masks to be prepared well in advance of the observation and to be cut out of plastic. This process isn't feasible for a space telescope, but works very well on the ground. However, times are changing. For example, for the MOSFIRE (Multi-Object Spectrometer for InfraRed Exploration) instrument at the Keck Telescope, the masks are created on the fly and "bars" that create slits are then moved into the right position within the instrument. Also for the upcoming James Webb Space Telescope a MOS unit will be available. It is designed in such a way that little shutters open and close to produce slits and masked out areas. For many other instruments however, a mask is essentially one large piece of plastic that has lots of tiny slits cut out of it. The slits are placed exactly where you want to observe an object. To create such a mask is in principle relatively simple and I illustrate the process here with a series of images.

I recently created some MOS masks for the Gemini Multi Object Spectrograph (GMOS) instrument at the Gemini Telescope to observe CANDELS galaxies and will use one of the masks I created as an example here to illustrate the process. Firstly, an image of the desired piece of sky in which the positions of the objects you want to observe are measured (Figure 2) and a list of objects, i.e. a catalogue, are required. From that list we  picked our desired targets. Often these are selected based on specific properties and limited by their brightness to ensure the maximum success with the granted observation time. Then we also need a list of stars to guide the telescope and to align the mask properly. Guide stars are used to correct for the rotation of the Earth throughout the observation so that the telescope is pointing at the same portion of the sky the entire time. You can see an example pointing in the first figure.


Figure 3: Zoom in to show the placement of slits on some targets. Objects with blue triangles have highest priority, next are objects with green boxes, and then those with white circles. The yellow vertical stripes overlaid on an object show where the slit will be placed and cut out of the mask. The horizontal white lines mark the extension of the dispersed light, i.e. the spectrum of the object. Basically, all the light that hits the disperser when it comes through the vertically extended slit, is dispersed in the horizontal direction.

Alignment stars are included on the mask to make sure all the slits are on the selected objects and not on some other piece of empty sky when the telescope operators define the pointing of the telescope. Then we take this image and list of targets and run them through the provided software for the given instrument.  Usually, the original list of targets leaves room for other objects to be placed on the mask as well, so we basically work with a prioritized list of objects. The highest priority objects are "forced" onto the mask into the space left after placements of the alignment stars to observe as many as possible of the desired targets. Then any available gaps are filled with objects of lower priority. In Figures 3 and 4 you can see all the slits that were placed on this particular mask and a zoom in that shows you a slit.


Figure 4: The finished mask. The red outline is the field of view of the instrument, the blue vertical lines mark the gaps in the detector. Each rectangle box shows where the spectrum of that object will extend. Yellow vertical lines mark the position of the slit on the selected object. The cyan rectangle boxes mark the position of the alignment stars.

After this, the observer can manually remove objects that received a slit if he/she wants the software to pick out a different object for example, one that might be more optimally placed. Then there are usually a few iterations in which the slit placement is refined a bit more and the maximum amount of objects are placed on the mask. And that's it, the mask is finished. All that is left to do is create all the masks for all the pointings in the same manner and then sending them off to the telescope and instrument support team for checking and approval. Once a mask is approved, all the necessary information is send to the mask cutting team who cut the mask, meaning all the tiny slits are cut out. After masks are cut, they will be installed in the instrument and then it's anxious waiting for us for the completion of your observations if they are carried out by the support astronomers at the observatory (Figure 5) or hoping for good weather if we go to the telescope ourselves to carry out the observations. 

The CANDELS fields are currently targeted by astronomers all over the world with many observational programs on instruments such as DEIMOS (on the Keck Telescope), MOSFIRE (on the Keck Telescope), GMOS (on the Gemini Telescopes, described in this post) and VIMOS (at the VLT, for example with the VIMOS UltraDeep Survey). 


Figure 5: Example observation from one of the GMOS masks. Each horizontal package of lines is the dispersed light from one slit. The bright vertical lines (a few are highlighted by the violet arrows) are emission lines caused by the night sky, meaning elements in our atmosphere emit light at certain wavelengths which are also detected and then overlap with the spectrum of the target object. The spectral traces of the target objects are highlighted by red arrows and are faint horizontal lines. In the red box, we can clearly see 2 bright dots, these are emission lines in the target object which we can use to determine its redshift and other properties. The green arrows point towards high energy cosmic rays that hit the detector and cause a detection. In order to retrieve the spectra for the target objects, astronomers have to remove the cosmic rays and subtract the spectrum of the night sky, so that ideally only the spectra of the real targets are left in the end.

Tuesday, December 17, 2013

Project Astro Kick-off at Donaldson Elementary School

Like last year, I and many other astronomers around the US are participating in Project Astro. Project Astro partners a teacher with an astronomer. We introduced Project Astro in this previous blog post and told you about the workshop that is held at the beginning of each new school year at the National Optical Astronomy Observatory in Tucson, Arizona. In short: The goal is for the astronomer to help the teacher to bring astronomy and science closer to the children in the classroom. Various activities support this goal.

This year, I am partnered up with Donaldson Elementary School's 4th grade classes. Donaldson Elementary is a public school in the North West of Tucson, Arizona. Each of its 4th grade classes consists of about 30 children. Last week, I visited the 2 classes for the first time. When I entered the class room, the children looked at me with big, excited eyes. As a welcome present they had prepared a book for me with drawings of what they think a female astronomer/scientist looks like. It was really touching and their art work was great. Their female astronomers came in all shapes and sizes and forms and colours. I particularly liked the one that put me on the moon!

What does a female scientist/astronomer look like? Here are a few example images of what the children thought before meeting me. Image credit: Janine Pforr, drawings from Donaldson Elementary 4th grade pupils.

We started off with just a general question and answer session, so the children could get to know me a little better and ask anything they wanted to know. One hand after another shot up. And boy, did they ask tough questions! For example: "What's left after a Supernova?" or "How did the Universe start?" or "How long can a person live in space?" or "What is the biggest star?" (You can check for a list of the largest known stars here, they are nearly 2000 times larger than our Sun). It was great and I was really impressed with their sheer endless curiosity.

Phases of the moon. Try to find the right order!
One solution is below, but no early peeking!!
Image Credit: "The Universe at your Fingertips"
and the Astronomical Society of the Pacific.
After that, we started our first activity, the phases of the moon. At the outset I had every child draw how they see the moon. Some drew full moons, some half-moons, some crescent moons. All had craters on them. Some added aliens and the American flag and the moon lander module. We discussed how everyone's drawing looked different and then I distributed little cards that have different moon phases on them, which the kids had to order. Naturally, most of them ordered the pictures from smallest crescent moon to full moon, thus creating half a cycle. The pictures however showed a full cycle. By drawing their attention to the details in the pictures, i.e. craters and mares, I had them rethink their choice and order. With a little help all of them managed to get the order properly and we talked about how often the moon cycles through its phases in a year and how long one cycle roughly is. Next time, I think we'll talk about what causes the moon phases and the seasons.

That day, the kids were very sad to see me leave, but I am sure we will have a great next visit.

With all the curiosity and interest of the children during my first visit, I have to say that I had one special highlight of the day. During recess, one of the little girls came up to me and asked if I was a scientist, which I confirmed. And then she said she wanted to become a scientist, too, when she was grown up. I thought that was very sweet and also exactly what many of us want to achieve with outreach events like this. We want to interest more children in astronomy in particular and science in general and encourage young girls especially that math and engineering and science is for them, too. 

One possible solution for the right order of the moon phases. Image Credit: "The Universe at your Fingertips" and the Astronomical Society of the Pacific.

Tuesday, August 27, 2013

Not a derby but the CANDELS 2013 team meeting

As we have for the last few years, the CANDELS team members come together to present the fruits of their labor over the last year to the rest of the team and discuss and make new plans for the coming year. This year, we're meeting at the University of Kentucky in Lexington.

Those of you who are following us on Twitter (@CANDELS_team and #CANDELS2013) might already have a pretty good idea on what yesterday was all about. If you didn't, let me give you a short description on what we did yesterday and you still have the chance all week to follow our live tweets.

Yesterday was all about giving status updates to the team, from the PI's, the data reduction and observation schedulers, most of the working group leaders and quick lightning talks from each member on their current CANDELS project. This is not only useful for long-term team members but also offers all the newly joined students and postdocs who participate in their first team meeting to get a quick update on available data, catalogues and on-going science projects.

After the first welcome and general logistics (and breakfast of course!), Harry Ferguson and Sandy Faber - the two PI's of the CANDELS survey - summarized the team's scientific accomplishments of the past year, listed their goals for the meeting as well as big science questions to address in the future. We learned for example that in the last three years, the CANDELS team published on average one paper every two weeks. That's pretty impressive and amounts to quite a number of publications. Many of which team members have already posted here about.
Poster advertising Sandra Faber's public talk at the University of Kentucky
Image credit: University of Kentucky, Dale Kocevski

With regard to observations and data reduction, this team meeting happens at a very special time. As Harry Ferguson already told you in this post, all planned observations for CANDELS are now completed. We have all the data! 

Then we moved on to the lightning talk round. A lightning talk round is exactly what it sounds like, it's over in a flash of a second. Everybody (about 50 meeting participants) had the chance to summarize their current CANDELS science projects in one slide and maximally two minutes. With all the different projects on-going, that is quite a tough job. But I thought everybody managed well and I'm looking forward to hearing more details in the science talks scheduled throughout the week as well as talking to people during the week about their projects.

Finally, most working group leaders gave short presentations highlighting some of the science results achieved within the working group in the past year. They also provided an overview over what data products and catalogues, like the redshift catalogues or multi-wavelength catalogues, are available for the team to use and where to find them. We heard updates from the Spectroscopy, High-Redshift, Extragalactic Background Light, Multi-wavelength catalogues, Clustering and Environment, AGN, Theory and the Education and Public Outreach working groups. Of course the blog was featured in my summary of the CANDELS outreach efforts. The day finished with a few theory-related science talks.

Tomorrow, the day will be structured differently. We will listen to more science presentations from team members and in the afternoon we will split into sub-groups to discuss current as well as future projects and "work to be done" in the working group sessions. And if you find yourself in Lexington, don't miss your chance to listen to Sandy Faber's public talk on "Modern Genesis: The Amazing Story of Our Cosmic Origins" at 7pm!

Tuesday, August 13, 2013

Reaching out for CANDELS outreach

On May 28th 2013, our blog turned 1! So Jeyhan and I decided, it's time to share what we have done outreach-wise with other people outside the CANDELS team that are interested in Education and Public Outreach (E/PO). At the same time we wanted to see what other people are doing in terms of outreach. And what better opportunity than the annual meeting of the Astronomical Society of the Pacific (ASP). Off we went with our poster under our arms to San Jose, where this year's meeting took place from July 20th to July 24th.

The annual meeting of the ASP is structured very similar to the annual meetings of the American Astronomical Society (AAS, we reported on those here and here). There are plenary sessions which are held in bigger auditoriums, so everyone at the meeting can attend, smaller concurrent sessions that anyone attending chooses according to their own interests and poster sessions during which everyone can come and read your poster and chat with you about it. This year's ASP meeting was special in that it combined two very important topics in one meeting. One half of the conference was called "Cosmos in the Classroom" and all sessions belonging to this category focused more on how to best teach Astronomy in school and college classrooms. The other half was called "Ensuring STEM (Science Technology Engineering Math) Literacy" which was more focused towards general outreach activities, such as our blog. Naturally, the background of the meeting attendants was quite widely spread, there were teachers for every grade, scientists like us that do outreach in their spare time and those that are hired to do outreach professionally. 

Jeyhan in front of our poster. Image credit: J. Pforr
However, the ASP meeting is much smaller in numbers compared to the AAS meetings. Fortunately, that meant that our poster was up all three meeting days and we had ample opportunity to talk and connect to other like-minded people, gather feedback and collect new ideas. 

On our poster we shared what CANDELS is and what our blog is about, what different types of posts we have, etc. We also gave an overview of statistics on the blog, how many people stop by the blog on a daily basis (on average of course), how many people have viewed it since we started and which parts of the world we have reached so far.

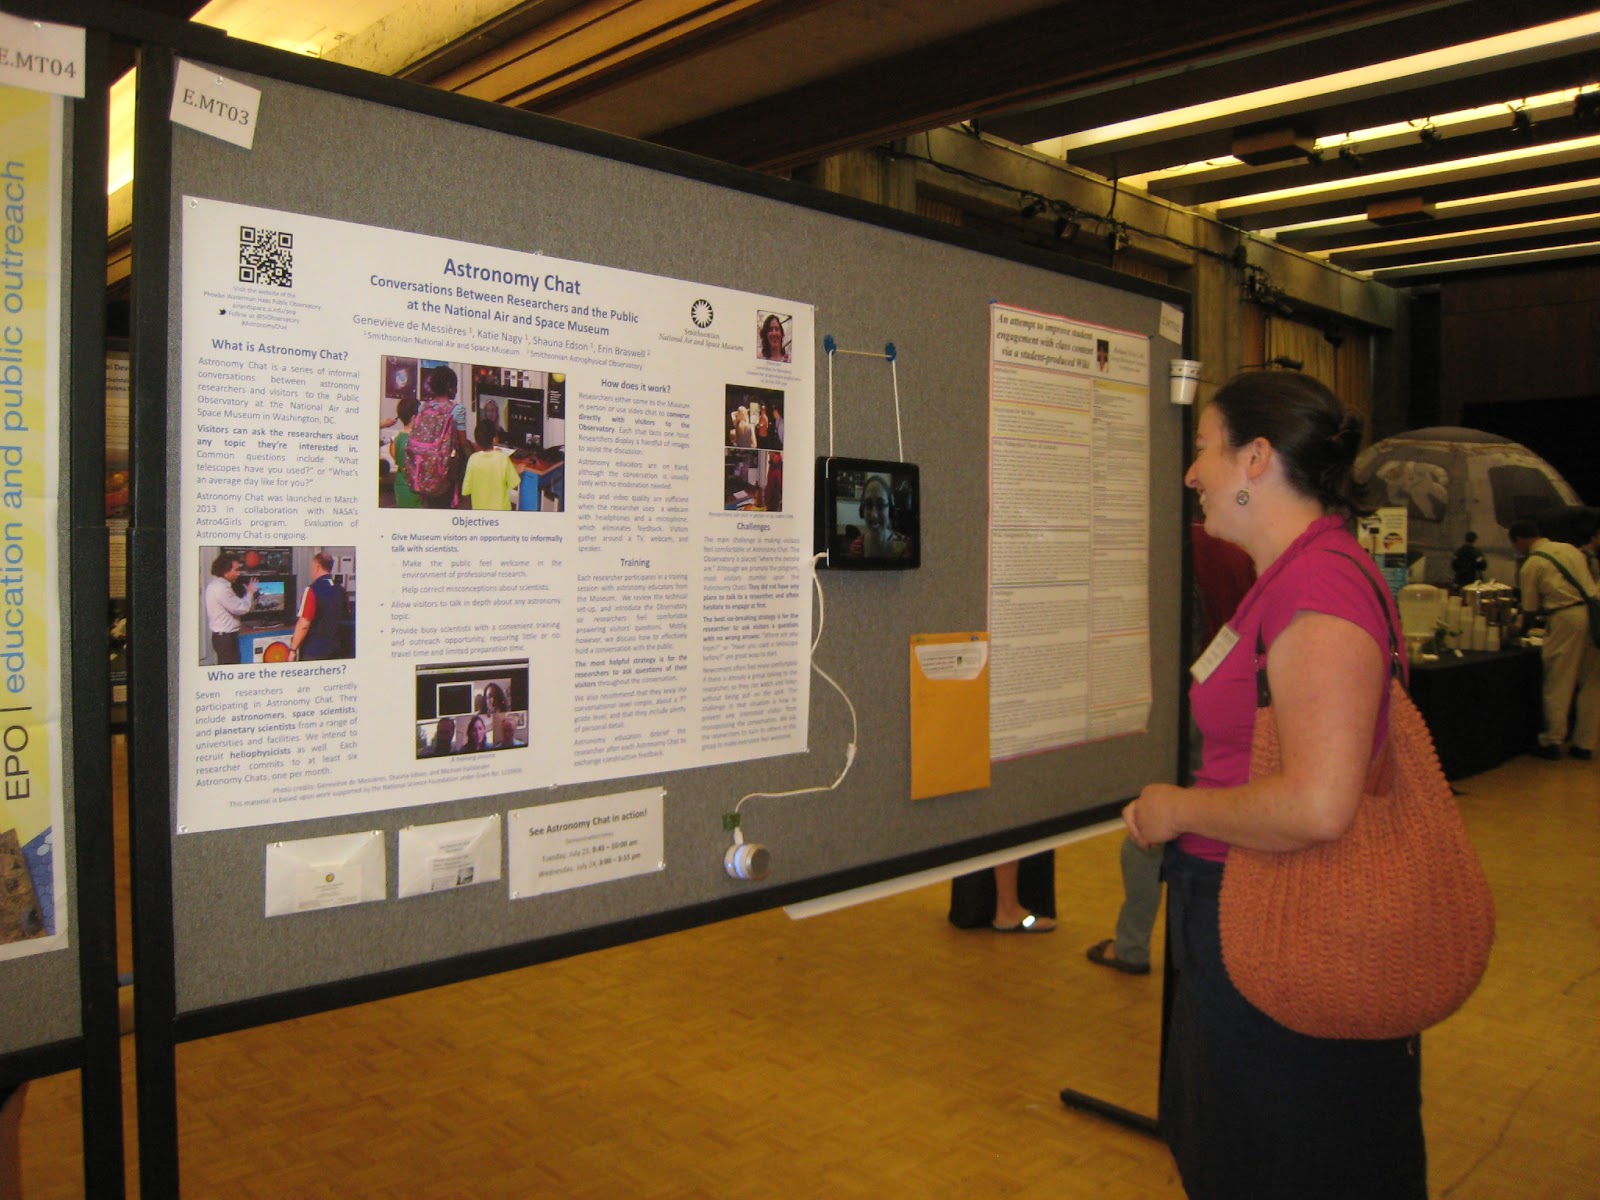
"Chat with an Astronomer" Poster at the ASP meeting. You can
see the little iPad next to the poster which connected to the
astronomer on the other side and provided an opportunity to
try it all out. Image credit: J. Pforr
We heard a lot about the outreach other people are doing and stumbled across fun things. One of them was the WorldWide Telescope. Interested parties could put on one of those virtual goggles, were given a game controller, and could fly through the Universe in proper SciFi fashion. 

Another cool thing was the "chat with an astronomer" poster by Genevieve de Messieres from the Smithsonian Institution and her colleagues. They explained how they are using their system at the Public Observatory at the Smithsonian National Air and Space Museum in Washington, DC.  During some of the poster sessions, there was an iPad and a microphone attached to the poster board next to the poster where you could actually talk to and see an astronomer on the other side of the country. I tried it, it worked really well!

The poster right next to us presented a new version of the game MyStar in which you build your own solar systems in our galaxy and can learn a lot about planet formation and extrasolar planetary systems. If you haven't tried it, I suggest you give it a go!

In another corner of the poster exhibition hall, there was a huge inflatable planetarium waiting to be tried out. You already heard more about a similar one in this blog post.

Right next to it, there was a huge blue screen. This was our chance to get recorded while "being in space". So if you stood in front of it, you were interviewed very briefly and filmed. The blue screen was then digitally replaced by an extragalactic space background so it would seem like you're actually in space. If I ever get sent the video of this, I will add it here.

Camilla Corona SDO visiting our poster! Image credit: J. Pforr
But besides all the fun and gadgety stuff to try out we also learned what challenges teachers and educators face when teaching astronomy and sharing their science with the world. We learned how to best put an Astro 101 course together and how to evaluate the success of an outreach project or college course. In interactive group work sessions we shared and found other creative ways to reach more astronomy interested people and how to improve communication.

All in all it was quite an information-packed meeting with lots of interaction. On the last day, we even had a special guest visiting our poster. It was Camilla Corona SDO! For those of you who have not heard about Camilla, have a look here, she's the former mascot of the Solar Dynamics Observatory now turned STEM ambassador, and she was very interested in our poster.  

Tuesday, March 12, 2013

Observing Comet PanSTARRS

Comet PanSTARRS viewed from Gate's Pass near Tucson, AZ, image credit & copyright: Janine Pforr
In the last post, we gave you some background on comets and highlighted a few of the more suspected-to-be-spectacular comets visible this year. Last night, a few colleagues and I went to a nearby viewpoint, to do some comet PanSTARRS viewing. 

Comet PanSTARRS
I
mage credit & copyright: Janine Pforr

We chose Gate's Pass near Tucson, which regularly offers a great view of the sunset and a brilliant night sky when it's clear. We arrived shortly after the sun had set (around 6:30 pm) and the sky was still a beautiful yellow, orange and red. Clearly, other people had the same idea - the viewpoint was filled with spectators equipped with cameras,  tripods, and binoculars, ready to spot the comet. We waited anxiously after reports from colleagues who were not able to see comet PanSTARRS at all the evening before and some who said they only saw it with binoculars. Around 7pm I heard the first people say that they spotted it in their binoculars. After a couple of test pictures and asking others for the exact comet location, we saw it, too! Once we knew where to look, even with the naked eye, we could just about see it. The comet started being visible above the horizon near where the sun had set. With the camera it was a bit easier because of the longer exposures. We were all happy that we could actually see it and now also have picture-proof. We watched the comet set slowly following the sun for about 30 minutes (see video).  

Time lapse video of Comet PanSTARRS setting at Gates Pass in Tucson, Arizona. Image credit and copyright: Janine Pforr. You can find a higher resolution of this video on our Facebook page at: https://www.facebook.com/candels.collaboration


If you are planning to go out and watch comet PanSTARRS, today is probably your best chance as comet PanSTARRS is expected to get a little bit brighter still. The best time to look is about 40 minutes after the sun has set. However, I do recommend to take binoculars with you, or a small telescope, to get a closer up view! We hope you enjoy the sight and would love to hear about your viewing experiences. Over the next few weeks, the comet will get fainter and further away from the sun. This will make it harder to see with the naked eye, but easier to see with a telescope. Some observatories, such as Kitt Peak, will have special events for viewing the comet.

Tuesday, March 5, 2013

2013 - The Year of Comets

Comets are small solar-system objects. They are often referred to as dirty snowballs because they are believed to mainly consist of ice and dust. But they also contain things like methane, ammonia, carbon dioxide etc.

Illustration of a comet's tails. Image credit: NASA
When comets come close to the sun, the radiation from the sun causes some of the comet material to be released, i.e. the ice is turned into gas and any dust within it is freed. This forms a coma of material around the comet's core; it's a little bit like an atmosphere. Due to the solar wind this material is pushed away from the comet and leaves a visible tail behind. In fact comets can have more than one tail. There is a gas tail that points in the opposite direction of the sun which consists mostly of gas atoms that are ionized by the suns radiation and a tail of dust grains that leans a little bit more towards the comets trajectory (see the illustration). The core of a comet is thought to be a few tens of miles/kilometers in size or smaller, the coma on the other hand can reach a million miles or more; that's about the size of the sun! Some comets can also have very long tails with some of the longest reported tails being as long as about 1 Astronomical Unit; that's the distance between the Earth and the sun!  

The tail and coma are what makes comets easily distinguishable from asteroids. However, every time a comet passes by our Sun it loses some of its material until eventually all the ice has gone and the only remainder might be a piece of rock. 

It is believed that most comets originate from the formation of our solar system. They are left-overs that didn't make it into a planet or moon. They mostly live in the Kuiper Belt and what is called the Oort Cloud. The Oort Cloud is a described as a sort of spherical area far out around our solar system that harbors a vast number of icy objects. Occasionally some of these collide or encounter other massive objects (such as the gas planets) that disturb their regular orbit. And sometimes the new path the comet adopts will lead through the inner solar system. When these objects come close to the Sun we observe them as comets. Some comets come by on a regular basis, such as the famous Halley's comet. They found a stable new orbit that can take the comet anything from a few years to more than 100,000 years to complete once. Comets with periods shorter than about 200 years are called short-period comets and are believed to come from the Kuiper Belt, those with longer periods on the other hand are called long-period comets coming most likely from the Oort Cloud. Rarer are those comets that only pass by once and are kicked out of the solar system forever. These comets are called hyperbolic comets, named after the shape of their trajectory.

Path of Comet PanSTARRS, Image credit: NASA
In the past we have had the pleasure to see many great comets in the night sky, the greatest ones even with the naked eye. This year, 2013, promises to be another great year for bright comets. There will be 2 very bright comets, one moderately bright one (Comet C/2012 F6 Lemmon) and one regular visitor (Comet 2P/Encke). Let me tell you here about the 2 brightest ones. The first one predicted to be relatively bright is comet PanSTARRS (official designation C/2011 L4 PanSTARRS) this month. It's got its name from the PanSTARRS survey which discovered this comet. Scientists predict that the brightness of this comet is going to be around as bright as the stars in the big dipper but brightness predictions are difficult. While being visible from the Southern Hemisphere already, comet PanSTARRS will be visible from the Northern Hemisphere starting March 7th (this Thursday), just above the horizon after sunset.
 
Comet McNaught in 2007, Image credit: ESA/NASA
Another great show will be put on at the end of November by comet C/2012 S1 ISON, which some say is expected to be brighter than the full moon!! This is indeed a rare occasion. Two Russian amateur astronomers discovered Comet ISON while observing for the International Scientific Optical Network (ISON) which gave the comet its name. Calculations of the comet's orbit revealed that it will pass very close to the sun (less than 1 million miles distance). Comets that come this close to the sun are called sungrazers. In the case of surviving this close pass to the sun, the view of this comet should be spectacular, possibly similar to that of Comet C/2006 P1 McNaught in 2007 (see picture). I will sure keep an eye out this year and try to spot one of these passers-by!

Friday, March 1, 2013

The week of the HST deadline

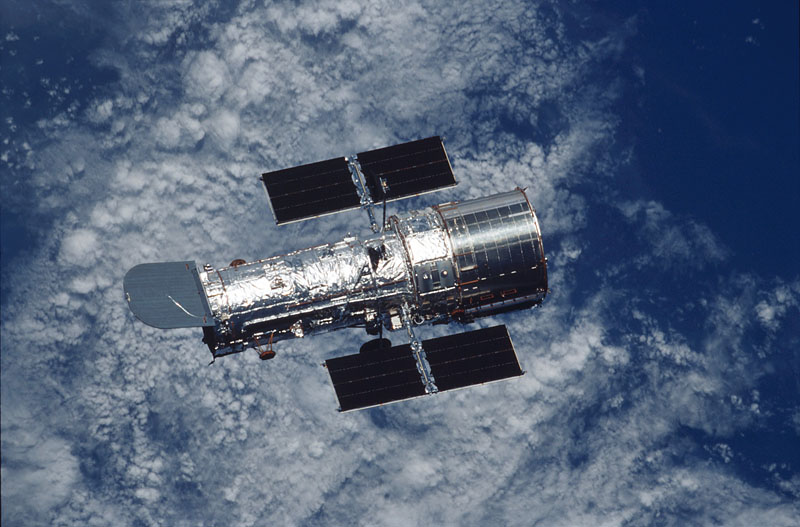
Hubble Space Telescope, Image credit: NASA
You might have been wondering why the blog has been so quiet this week. Well, the deadline for another round of proposals using the Hubble Space Telescope (HST) is this Friday, March 1st. Many CANDELS team members are caught up in frantically writing and finishing observation proposals. An observational proposal requires a lot of work. Not only does one have to present a scientifically interesting idea, the so-called science justification, for the use of an expensive facility like the HST, the proposal writers also need to put together a technical justification. The latter includes a more detailed observation strategy that outlines number and length of the proposed observations and which available instruments will be used. Since often many astronomers build a team (just like CANDELS although usually a lot smaller) to propose for their idea, everybody is involved in putting the proposal together and constantly communicates with each other right up until the deadline to make their proposal as strong as possible. For HST several types of proposals can be submitted. The first type is the so-called archival and theoretical proposal, which is mainly a proposal for funding to support one's research. As the name indicates, astronomers base their research idea upon already existing observations in the HST archive or theoretical work that they need support for. The second type is proposing to carry out new observations with HST.

Like all telescopes, observing time with HST (and funding) is highly competitive and many more astronomers will submit proposals than there is time available (or money to spend). However, we won't know which proposals were accepted before the end of May. Once an observing proposal is accepted it has to successfully pass Phase II. This includes working with an assigned program coordinator at the Space Telescope Science Institute in Baltimore, that runs HST, to put together a plan for the observations which then can be scheduled on HST. This observational plan has to be submitted by the end of June, so only about a month after one has been notified that the proposal was accepted. However, a proposal is only fully accepted once all the technical details for the observation plan have been successfully worked out, it has been assured that the same (or very similar) observations are not carried out more than once (e.g. different proposers want to observe the same piece of sky in the same filter bands and depths or an observation exists already in the archive) and it has been checked that all observational requirements are technically possible and feasible for HST. When all these hoops have been jumped through, HST can take the data and astronomers can analyze and interpret it and then publish their results.

Thursday, January 31, 2013

And the Winner is....

As you know the CANDELS team consists of many scientists who work on various aspects of galaxy evolution, supernova science and theory.

Rachel Somerville
Rachel Somerville is one of the theorists on the team. You can read a post in which she describes some of her work here. This month, she was awarded the Dannie Heineman Prize for Astrophysics. One outstanding astrophysicist is selected every year by the American Institute of Physics and the American Astronomical Society to honour his or her contribution to the field. Rachel received the prize for her work on semi-analytic galaxy formation models. In particular she has been working on  understanding the connection between galaxy evolution and the evolution of supermassive black holes. Within CANDELS she is combining the observational data with simulations and galaxy formation models to solve the puzzle of galaxy formation.

Like many astronomers, Rachel has lived and worked at quite a number of Institutes around the world, after receiving her PhD from the University of California in Santa Cruz. She is now a Full Professor and the Downsbrough Chair in Astrophysics at Rutgers University. Rachel is very happy and honored to receive this prestigious prize and for the recognition of her work. She said: "Working with observational collaborations has been my biggest source of inspiration over the course of my career. Being involved with the CANDELS project is particularly exciting for me because it has brought together observations at so many different wavelengths, as well as a large team of people with different interests and expertise, including a large number of theorists!"

The Heineman Prize is funded by the Heineman Foundation for Research, Educational, Charitable and Scientific Purposes, Inc. and is named after Dannie Heineman who as an engineer himself was a great advocate for science and education. This prize comes with $10,000 prize money and will be officially bestowed upon Rachel at a future AAS meeting. Since the first awardee in 1979, only 3 women (including Rachel) have received this prize, one of which was Sandy Faber who is also one of the CANDELS-PIs. Read more about Rachel and this prize here.

Sandy Faber
Sandy Faber, too, was recently honored. She is one of the 12 scientists to receive the National Medal of Science this year. The National Medal of Science is the highest award for scientists and engineers in the United States and was first awarded in 1963. Each year, scientists and engineers are honored for their outstanding contributions in various fields such as mathematics, physical, biological, social/behavioural sciences, engineering, chemistry and computing. The award ceremony for the National Medal of Science will be held at the White House tomorrow morning (Feb. 1) at 11am and you can watch it live here.

The CANDELS team is immensely proud to have such outstanding team members. Many congratulations to Rachel and Sandy!

Thursday, January 17, 2013

3000 astronomers in Long Beach

Jelly fish at the Aquarium of the Pacific in Long Beach, CA
where the opening reception of the AAS meeting was held
Image credit: Jeyhan Kartaltepe

Last week many astronomers meet up again at the Winter meeting of the American Astronomical Society. You can read about the Summer AAS meeting in Alaska here. This time, the meeting took place for 4 days in Long Beach, CA. AAS meetings start officially with an opening reception on Sunday evening. Here astronomers have a chance to mingle and catch up with those friends and colleagues they don't see that often while having a bite to eat and a drink. This time the opening reception took place in the Aquarium of the Pacific which is located near the Convention Center where the rest of the meeting was held. The aquarium was a big hit with everyone since we were able to walk around the exhibition, look at lots of fish, jellyfish, crabs, shrimp and many other sea creatures. Some of them we were even allowed touch (of course under supervision of aquarium staff)! If you get a chance you should go visit, and then imagine the aquarium being packed with thousands of astronomers.

On Monday, the real meeting started with talks and poster presentations. Because so many people come together in one place, AAS meetings and their schedule are usually very busy. Lots of people give presentations (one usually has 5 minutes for a talk) or show a poster about their work. Since the meeting is only a few days long, talks are grouped into sessions according to their topic and many sessions run parallel.

Many of the CANDELS team members participated in the meeting. In fact, we had an entire talk session full of CANDELS Science talks on the first day. Our session was started off by Guillermo Barro who told us about his recent paper on the progenitors of compact quiescent (no longer star forming) galaxies. It is still unclear how such massive and yet extraordinarily small and compact galaxies formed. So some astronomers, like Guillermo, are looking for the progenitors as predicted by different evolutionary scenarios. 

Next, Jeyhan Kartaltepe presented her work on the morphologies of extremely luminous infrared galaxies. By using the extensive morphological classification scheme in CANDELS she compared the morphologies of luminous galaxies at different redshifts in order to determine how the role of galaxy mergers has changed over cosmic time. Mark Mozena then presented his dissertation work in a 15 minute talk. He discussed how he is using the CANDELS classifications to learn about the morphologies of redshift 2 galaxies. He also compared the morphologies of observed galaxies with those of model galaxies using the same classifications.

Christopher Conselice presented the cosmological implications of major and minor mergers by investigating the merger histories of galaxies across time. In particular he showed how mergers can be identified through measurements of morphology.  

Then Viviana Acquaviva and I talked about the difficulties in determining the redshift of galaxies using only photometric data and spectral energy distribution fitting. My talk focused on the treatment of very dusty galaxies while her's introduced the use of reasonable assumptions in the derivation of photometric redshifts with her code that is based on a Markov Chain Monte Carlo (MCMC) technique.

Janine Pforr standing in front of the poster presenting the CANDELS blog
during the AAS meeting in Long Beach, CA. Image
Credit: Jeyhan Kartaltepe
The session was finished off by Carlos Vargas on the question of whether data stacking (i.e. the adding up of lots of images or spectra) helps in the analysis of Lyman alpha emitting galaxies which are very faint at high redshift and only stick out due to their strong Lyman alpha emission. In particular, he discussed how different stacking methods frequently used to enhance data and study the average properties of such galaxies affect the result.
 

But Monday was not only a busy day in terms of oral presentations of the CANDELS team. We also presented a poster about this blog (shown to the left). This gave us a great opportunity to share the blog with the larger astronomical community, meet new people that are interested in blogs and public outreach, and discuss ways to improve the blog. It was a great day to start off the meeting and we will tell you more about the remaining days of the meeting in the next few posts.